2021 – 2022
Printed Editorial Report
Online Interactive Story
Data Visualisation
Design a printed academic report and web story to present the findings from the first year of the C-THRU project, which aims to connect with policy makers and interested parties outside of academic circles.
C-THRU is a 3-year, US$4m, international research project which aims to deliver carbon clarity for the global petrochemical sector. The team, led by Professor Jonathan Cullen, will explore options for reducing the sector’s pressure on the environment.

This was the second report that we had worked with the team from Refficiency Collective at the University of Cambridge on, so we had already a good working relationship. However with this project there were a number of international partners producing copy and graphics for the report. This meant one of the major challenges was to create a cohesive design that unified all these graphics. We also had the opportunity to create some unique data visualisations in the report too. This report would be the first in a series of three, which would span the timeline of the C-THRU project, so this report would need to set the design tone and language for future reports and collaterals.

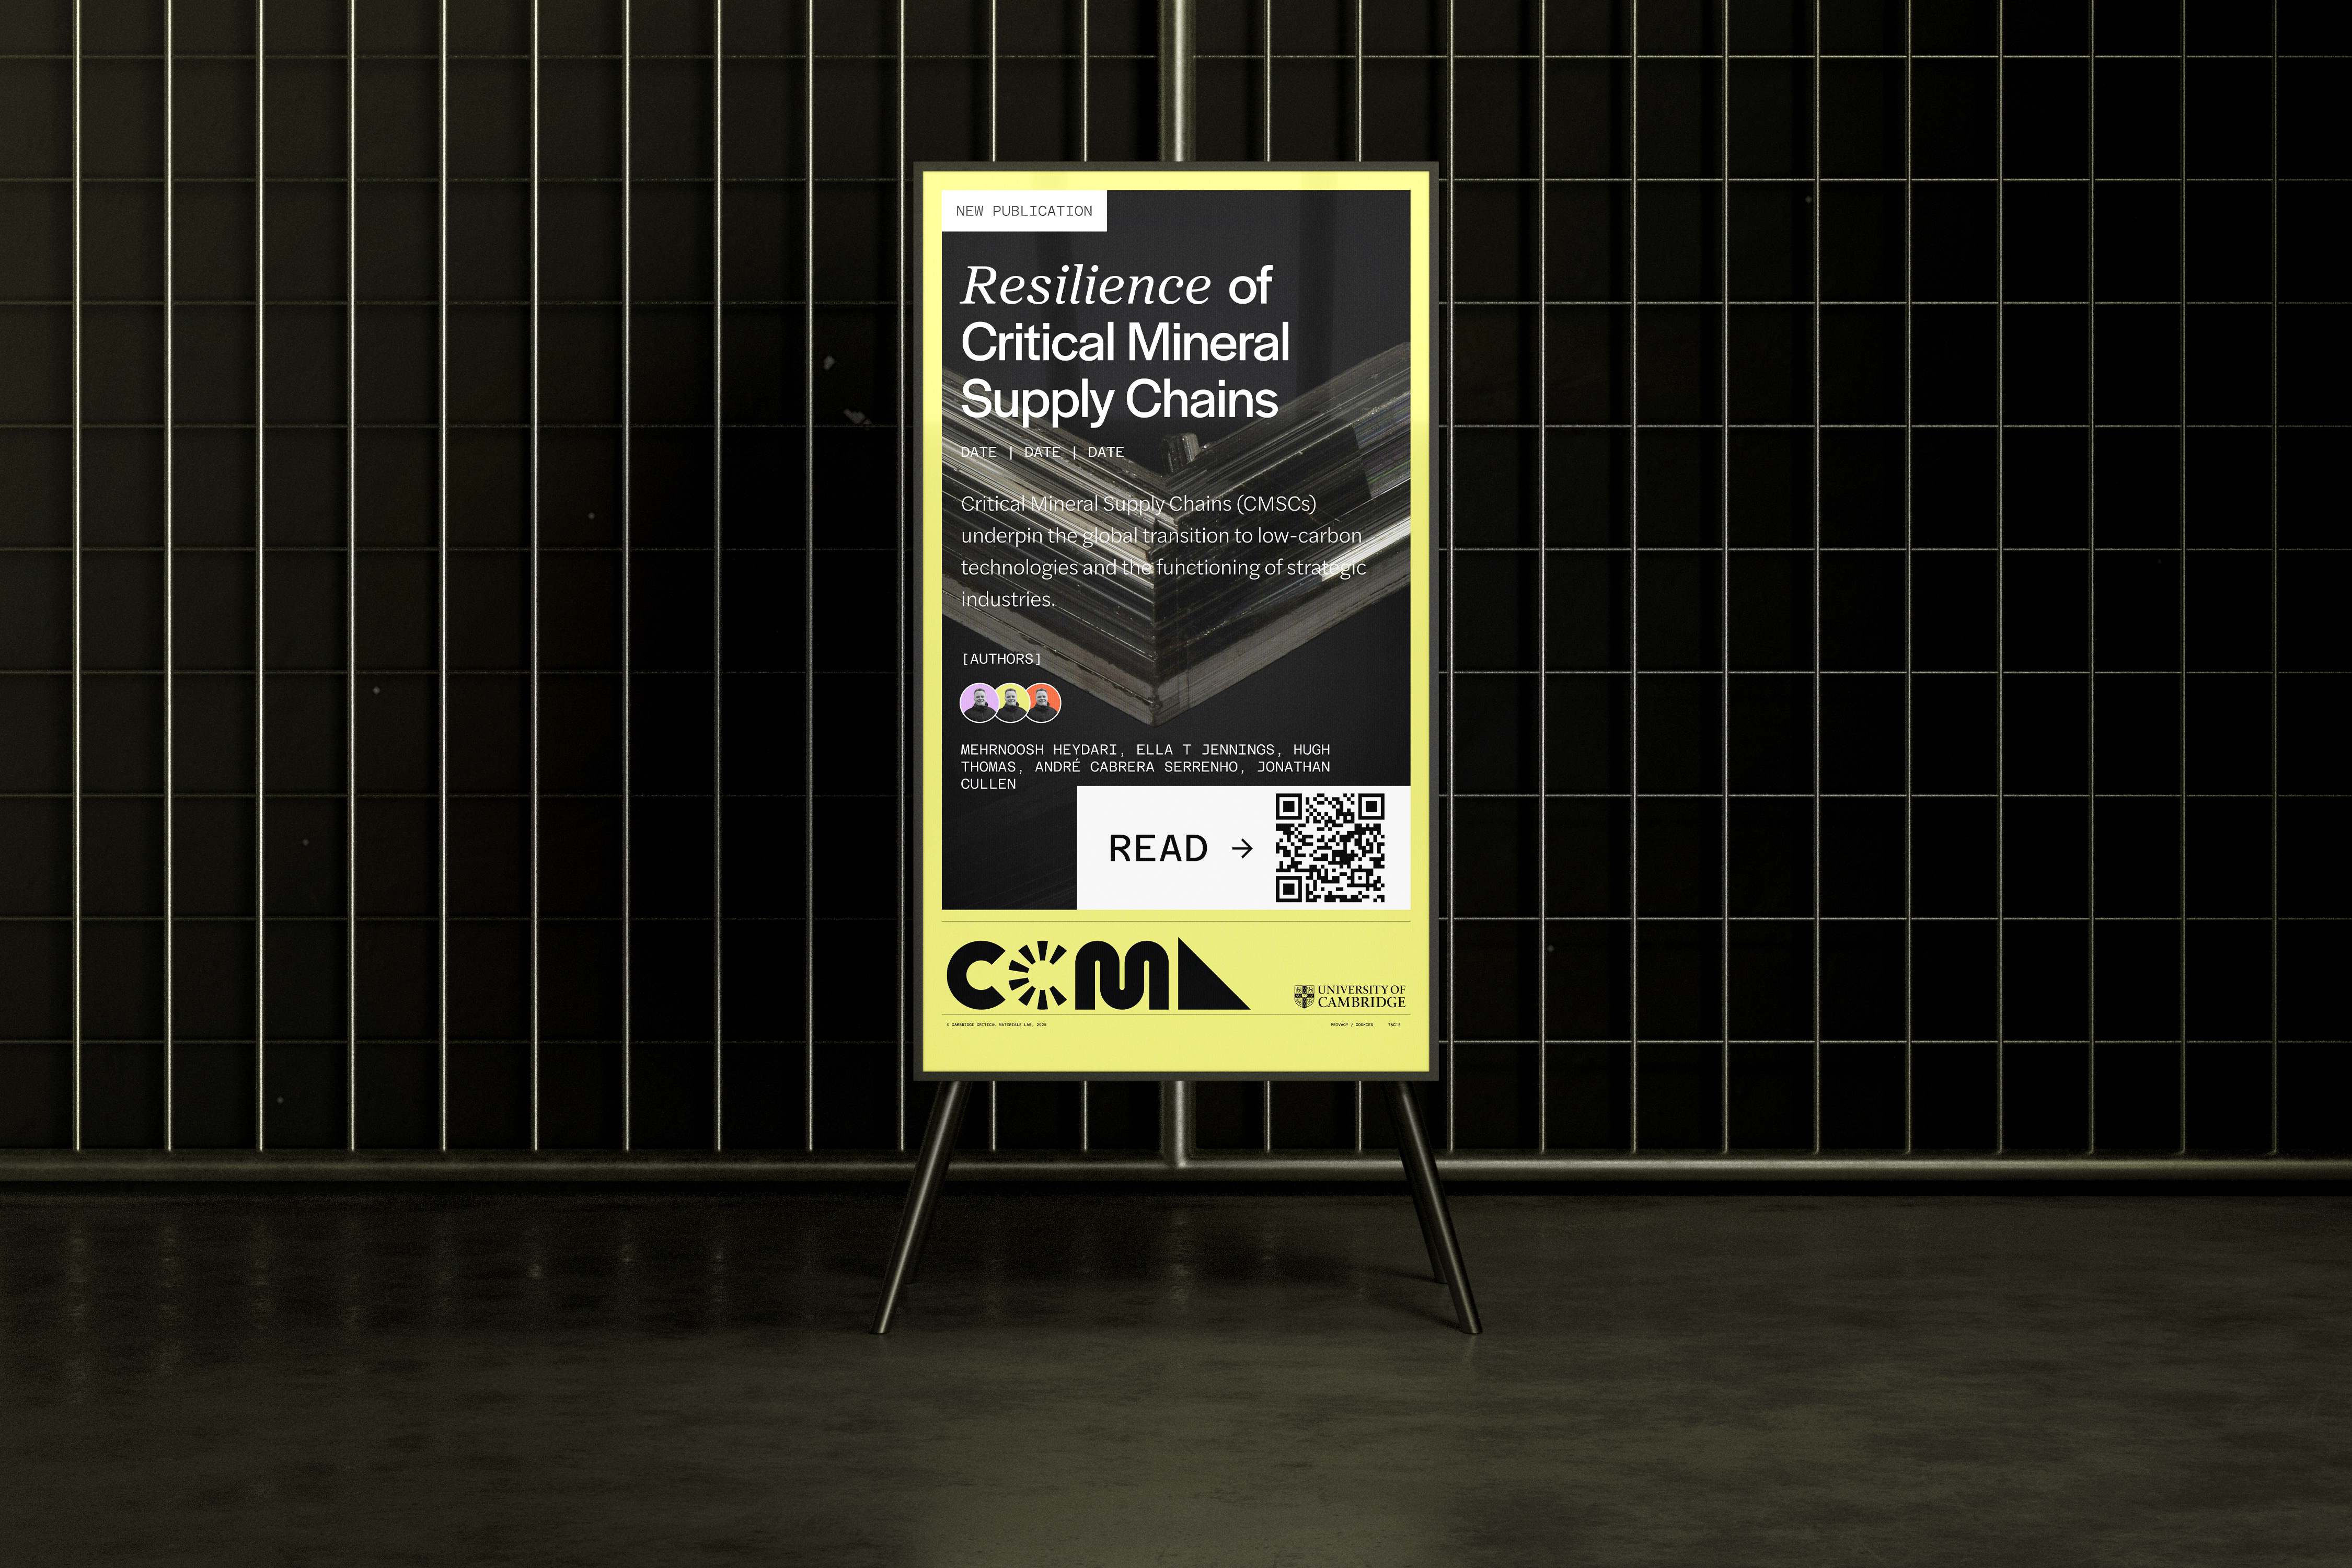
With this report focusing on the status of carbonisation within the petrochemical supply chain, we wanted the visual style to reflect the industrial side of the chain, opting for rough edges, black and white photography with bold colours that mirrored the variety of petrochemicals and their uses. Over the course of a year we worked closely with the Refficiency team to curate and produce the final report.


We’re really proud of the final first year report with its unique design and it was successful in unifying the copy and graphics from multiple sources. The report and web story were published in October 2022. You can see the full report at c-thru.org.uk/first-year-report